

The Tools, Resources, and Prompts tabs only load data when the selected server
is connected. If the server is disconnected, the tabs clear any previously
loaded primitives and display a prompt to reconnect. Refresh, run, and read
actions are disabled until the server is connected again.
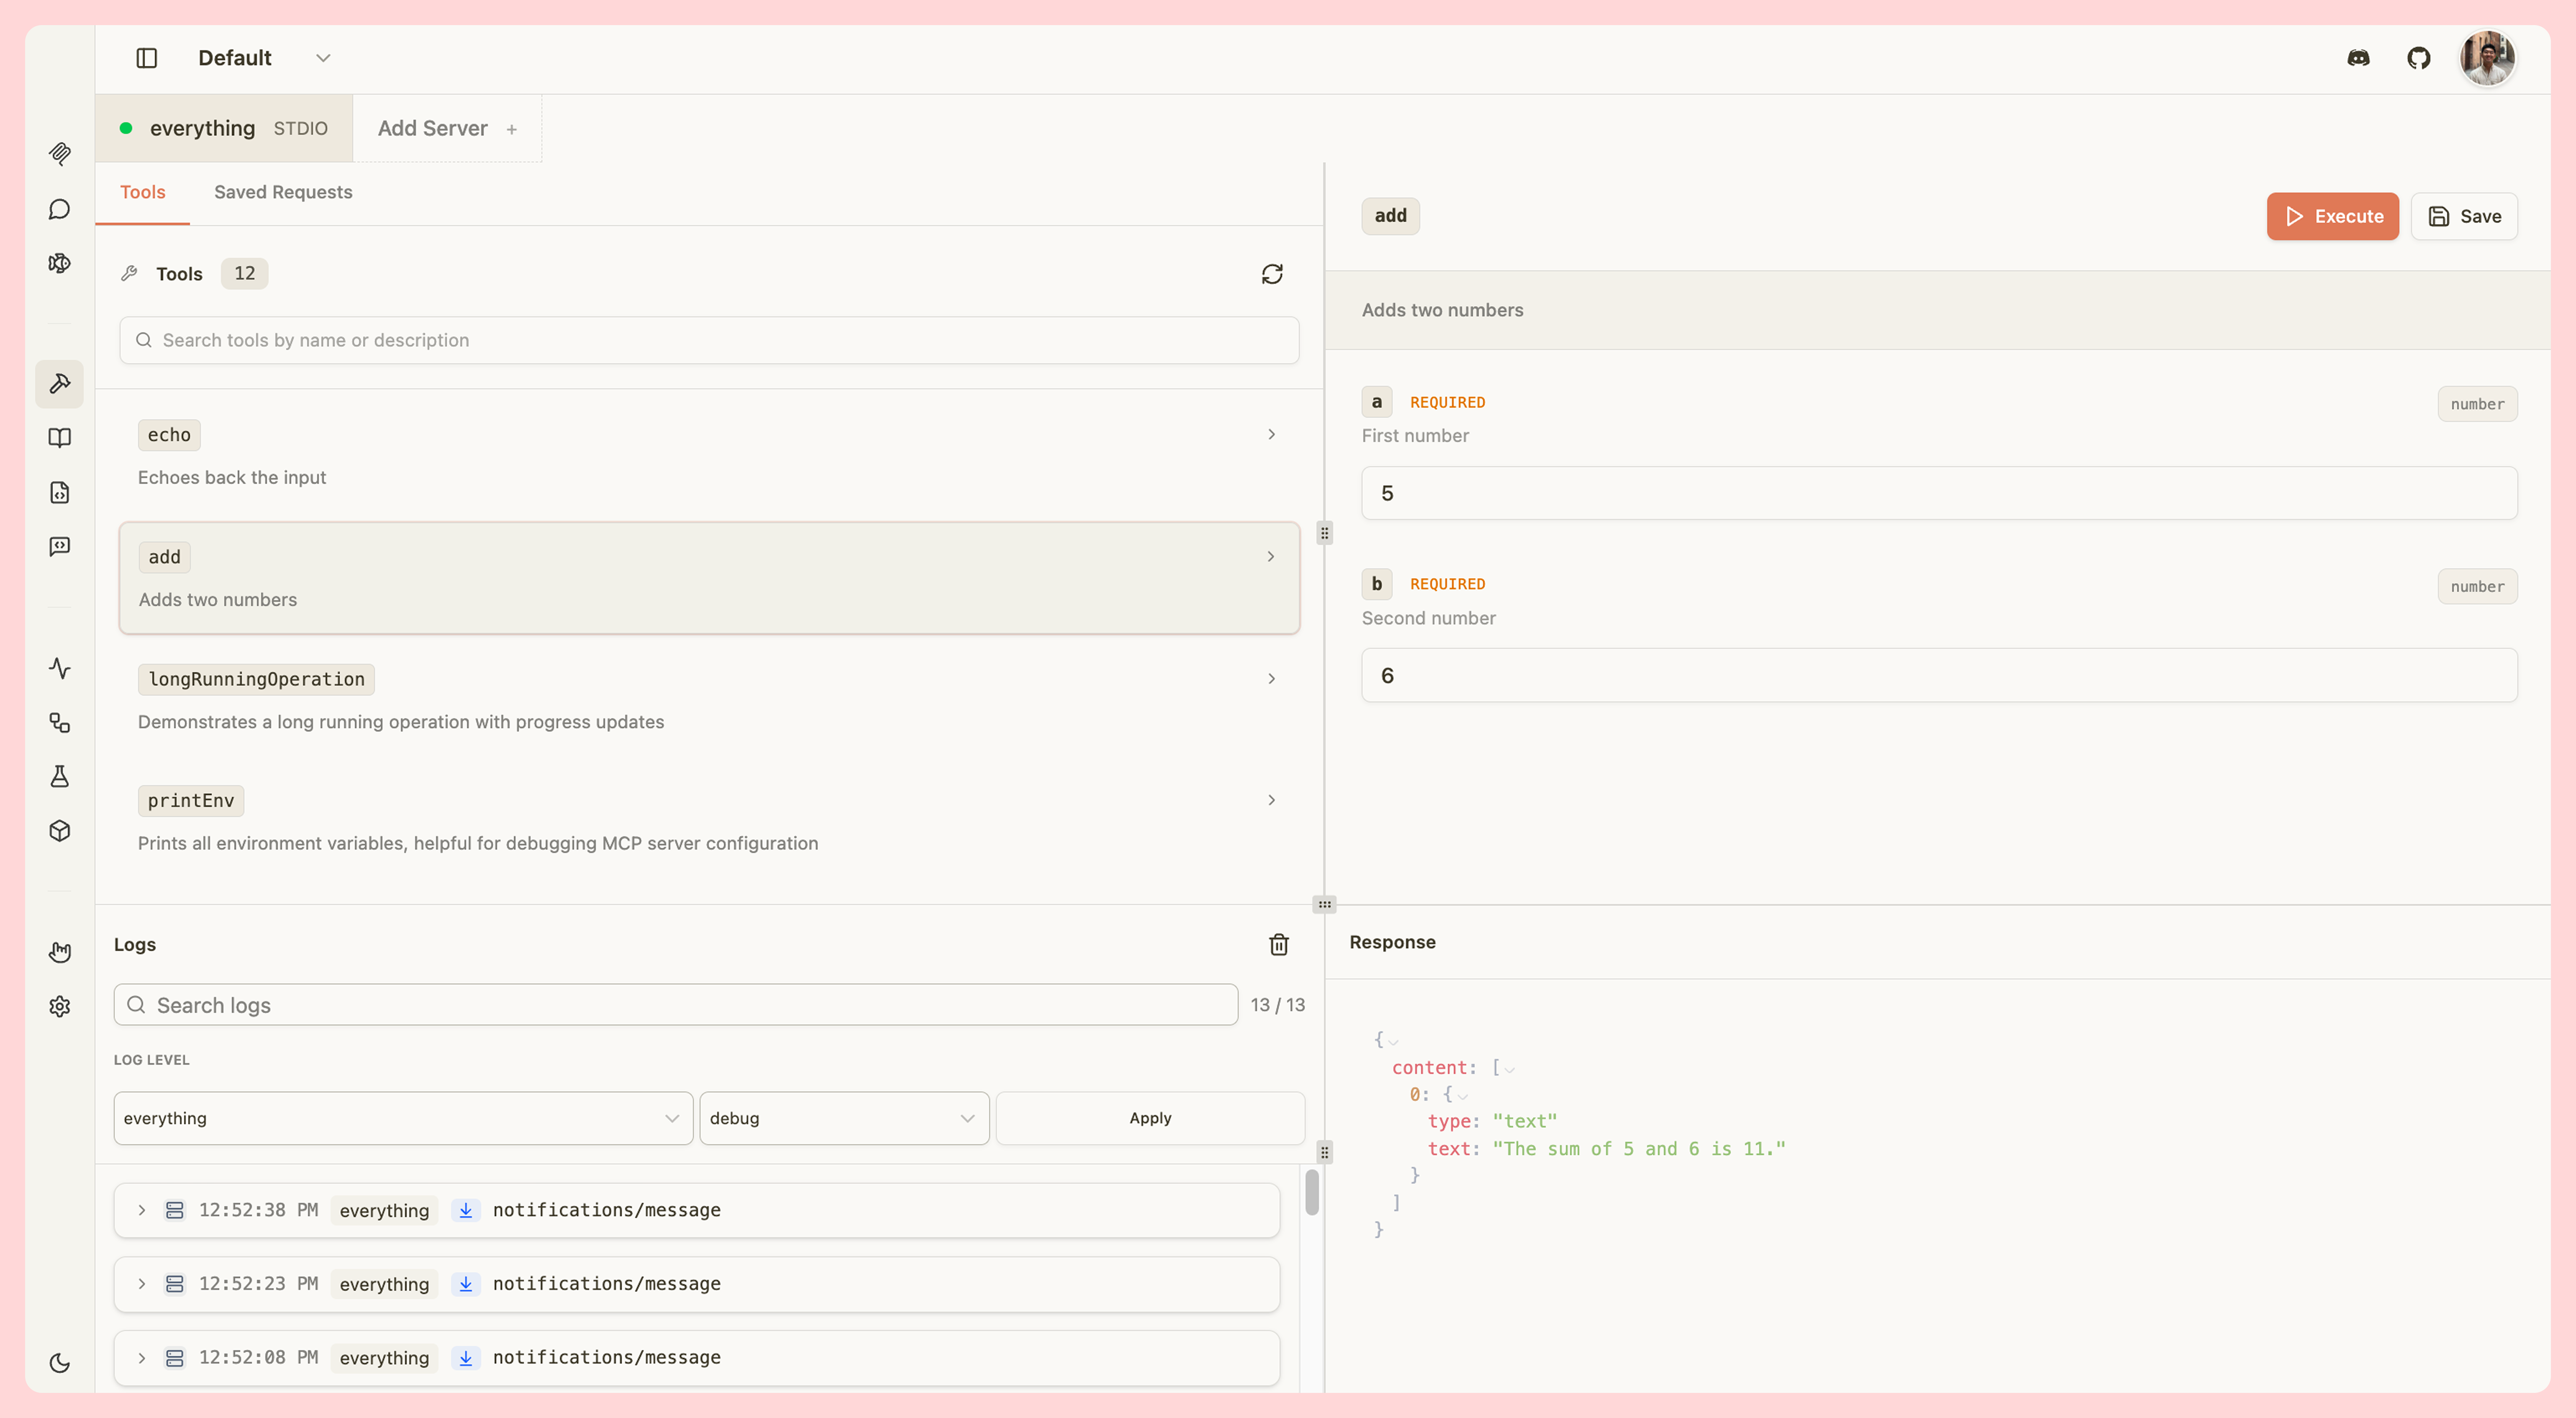
Tools
Test your MCP tools by manually invoking them with custom parameters:- View all tools - Browse tool names, descriptions, and parameters
- Search tools - Quickly find specific tools by name
- Invoke tools - Trigger tools with custom input parameters
- View results - See tool outputs, including widget responses for ChatGPT apps and MCP apps
- Elicitation support - Handle elicitation requests from tools
- Save requests - Save frequently used tool invocations for quick testing
- Quality badges - See per-tool quality indicators in the sidebar for tools with definition issues
Tool quality badges
When enabled, each tool in the sidebar may display a small badge showing the number of quality findings for that tool:
Hover over a badge to see the full list of findings. Tools with no issues show no badge.
Saved requests are stored in your browser’s local storage and accessible from the Saved Requests tab.
Resources
Inspect your MCP server’s resources:- Browse resources - View all available resources with names, URIs, and MIME types
- Read resources - Fetch and view resource content
- Resource templates - Test templated resources with dynamic parameters
Prompts
Test your MCP prompts:- View prompts - Browse prompt names, descriptions, and parameters
- Fetch prompts - Retrieve prompt content with custom arguments
- Use in Playground - Type
/in the Playground to insert prompts directly into the conversation
JSON-RPC Logging
All communication between MCPJam and your MCP server is logged in real-time:- Request/response pairs - View complete JSON-RPC messages
- Message types - See tool calls, resource reads, prompt fetches, and more
- Error tracking - Inspect errors and validation issues
- Timestamps - Track message timing and performance
OAuth log entries
When a server uses OAuth, each step of the OAuth flow appears as a log entry in the traffic log alongside regular JSON-RPC messages. Use the Source filter dropdown and select OAuth to show only OAuth entries. Each OAuth log entry displays a status indicator:
Click any entry to expand it and inspect the full step payload, including HTTP request and response details.